
Local government has been hit hard by austerity. On average, grants from central to local government have reduced by 49.1% in real-terms over the period 2010- 2018, translating into a reduction in real spending power of close to 30%.
Demand for statutory services such as social care, children’s services, and homelessness have also increased, due to widening inequalities and policy inertia on the crisis in social care. Taken together, these factors mean the period since 2008 has been particularly challenging for local government.
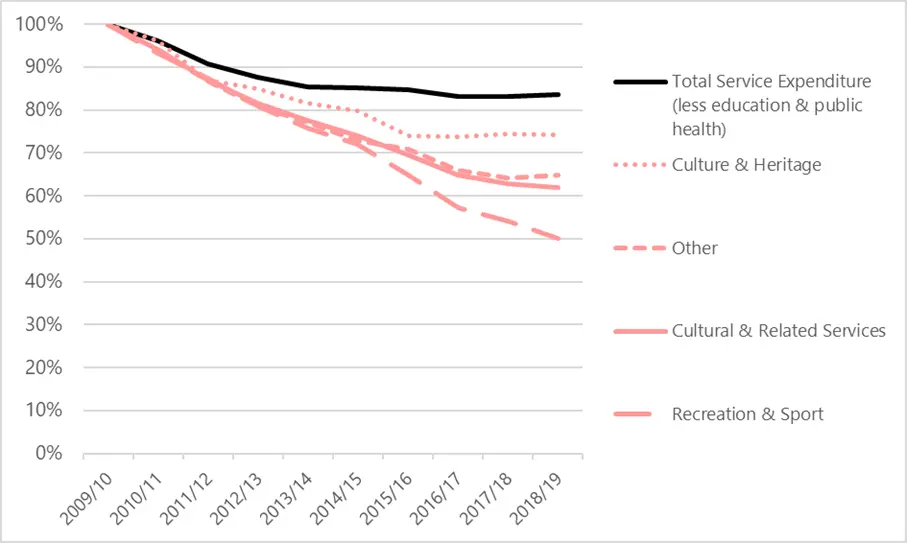
Relative reduction in expenditure within ‘Cultural and Related Services
Local government is often cited as one of the biggest investors in culture, spending over £2 billion a year on services related to culture. Earlier research (£) found that local authorities’ spending on the arts first exceeded that of central government in 1988-89 and has done so ever since. Significantly, the question of what counts as ‘culture’ and ‘the arts’ tends to be interpreted differently. Nevertheless, local authorities are an important investor in cultural provision, with the balance between central and local government looking different depending on the data used. For example, the £2 billion figure quoted previously refers to spending on culture and leisure, including services like golf courses, along with libraries, museums, arts development and suchlike.
In order to build a nuanced picture of local authority spending on cultural services after a decade of ‘austerity’, we have looked to see what the data can tell us about patterns in expenditure and income between 2009/10 and 2018/19. We’ve largely focused on the ‘Culture and Heritage’ category, using data submitted to the Ministry of Housing, Communities and Local Government (MHCLG). This category comprises spending on archives, arts development and support, heritage, museums and galleries, theatres and public entertainment. Our analysis, published open access in the journal Cultural Trends, shows a combined total spend of £818.5m on ‘Culture and Heritage’ amongst English local authorities in 2018-19. For context, in the same year, the Department for Digital Culture Media and Sport (DCMS) spent £452 million on museums and galleries and £723 million on ‘Arts, Culture and Libraries’.
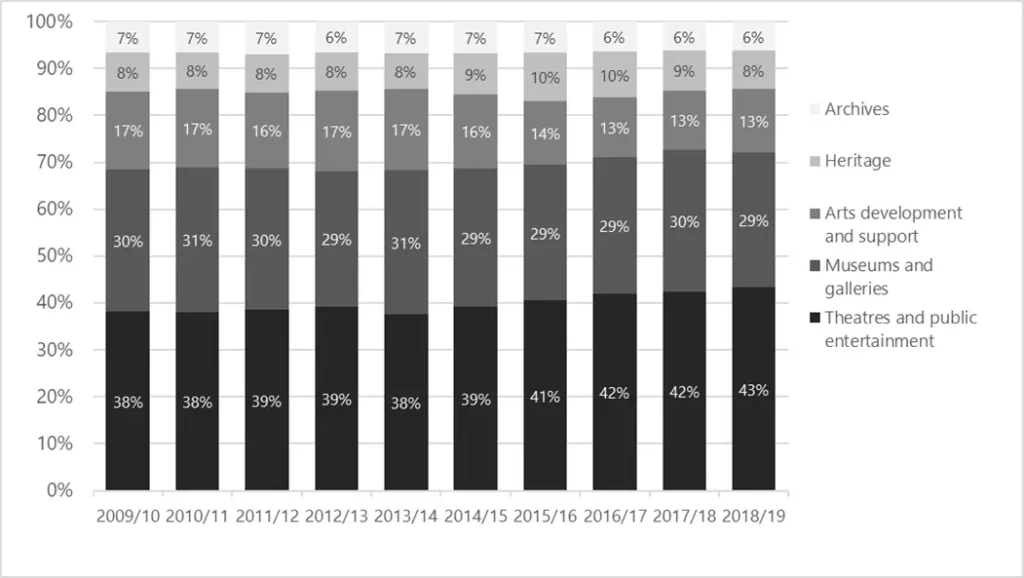
Relative expenditure within ‘Culture and Heritage
Our aim in the paper is to move beyond knowing austerity just through averages. Much reporting on spending cuts quotes average figures. This gives the impression that austerity has hit all areas equally, producing equivalent reductions in spending on cultural provision. We show that this is far from the case.
Looking at the data, what is most striking is the variation in spending cuts. While most areas have reduced the amount spent on ‘Culture and Heritage’, cuts range from 1% to 94%, with a minority increasing spending over time.
In the paper we develop a classification system to explain this variation in expenditure and income change over time. We present maps to show the geographical distribution of the categories. Dynamic versions of these are available online, giving access to individual local authority data on gross and net expenditure, income, and importantly the change in spend per person between 2009/10 and 2018/19.
We are also able to extend existing research showing a shift away from discretionary spending by pinpointing the services that have been particularly vulnerable to cuts. The majority of local authorities have made drastic cuts to ‘Arts Development and Support’, the category covering grants to local arts organisations. Despite prior spending, twenty local authorities cut spending entirely during this period. Reading these figures alongside Arts Council England’s 10-year strategy with its focus on supporting a broader range of cultural activity in “every village, town and city” indicates a potential gap between policy ambition and the reality on the ground.
Looking more closely at the data, we show that many local authorities have always had low (or no) expenditure per person on ‘Culture and Heritage’. We find clear clusters of major reductions in expenditure on ‘Culture and Heritage’ in the North West, the West Midlands, and in parts of the South West. However, 14 of the 32 London boroughs also fall into this category, highlighting that London has not been immune to cuts to local service spending – far from it. There are 12 areas where spending has dropped by over 75%, 4 of which are London boroughs. At the other end of the scale, there are councils spending more: Islington, Haringey, Waltham Forest, South Gloucestershire, Blackpool and Nottingham.
Importantly, income drops over the period by an average of 2%. 61 of 152 local authorities generated a higher level of income from ‘Culture and Heritage’ in 2019 than in 2009. Our analysis complicates the picture of London and the South East benefitting the most from a shift towards earned income: local authorities seeing comparatively higher levels of income in 2018/19 are spread relatively evenly across the county.
Intriguingly, when the Indices of Multiple Deprivation (IMD) are used a proxy for deprivation, no straightforward relationship between grant dependence and cuts is discernible. There is scope for further work here as alternative measures of deprivation may produce different results, and there are other factors – such as demand for social care and revenue raising ability – which impact on a council’s ability to fund non-mandatory services. Although we didn’t find a clear relationship between political control and cuts, local politics can also be a factor in determining the extent and shape of cuts.
Throughout the paper we offer potential explanations for these spending patterns where possible. We were able to draw on existing scholarship and ongoing conversations with colleagues at the Local Government Association (LGA) on how local government works to detail the political, financial and legal contexts within which these decisions are made.
We feel it is important to point towards these institutional explanations as a counter to commentary which has tended to assume that decisions about cuts can be attributed to the ‘choice’ of individuals or councils who either value culture or don’t. It’s not that this isn’t a factor, but it’s one amongst many. Spending on discretionary services will also be impacted by statutory service pressures, as well as whether a service can be redesigned to generate income through fees and charges, as previous research has shown. In this context, we can see why ‘Arts Development and Support’ has been vulnerable.
Our analysis raises a host of questions about the way austerity has played out unevenly and differentially across England. We hope to temper narratives of austerity as straightforward ‘decimation’ or ‘decline’ and instead draw attention to the contemporary moment as one in which local cultural provision is being restructured and repurposed towards different ends.
Context is key here, as we knew when we began our analysis – the data can only tell us so much. Contextual factors enable and constrain the capacity of local authorities to adapt and this paper forms part of a larger research project which aims to understand these dynamics. We hope others will also draw on our analysis to build a deeper understanding of the shape of local government provision after a decade of austerity.
Clearly, long-term investment is needed but so too is a strategic approach which supports local authorities to develop services which resonate with today’s concerns.
This blog draws on a research article, published open access in the journal Cultural Trends
Bethany Rex is a Leverhulme Early Career Fellow in the Centre for Cultural and Media Policy Studies, University of Warwick. She has been a Research Fellow on Creative Lenses, a 4-year collaboration project funded by the European Commission and has undertaken an AHRC Creative Economy Engagement Fellowship. Her background spans museum and heritage studies and cultural policy, with a particular interest in exploring the processes and politics of organisational change in state-funded arts and cultural organisations in the UK prompted by twenty-first-century austerity.
Peter Campbell is a Senior Lecturer in the Department of Sociology, Social Policy and Criminology at the University of Liverpool working primarily in the fields of social research methods and cultural policy research. His latest monograph is entitled ‘Persistent Creativity: Making the Case for Art, Culture and the Creative Industries’\
Thumbnail photo by Harry Grout on Unsplash and hero photo by Glodi Miessi on Unsplash
The PEC’s blog provides a platform for independent, evidence-based views. All blogs are published to further debate, and may be polemical. The views expressed are solely those of the author(s) and do not necessarily represent views of the PEC or its partner organisations.
Related Blogs

Measure what matters: Priority pathways and Creative Higher Education
Bernard Hay, Creative PEC's Policy Director, investigates the surprising absence of creative subject…

11 actions for the cultural and creative industries in the age of AI
A guide to help the cultural and creative industries address the rise of AI, from the GCEC.

Creative Resilience in Times of Crisis
Introducing A Global Agenda for Creative Resilience, an 11-point strategic framework for strengtheni…
Reporting from the Creative PEC Research Symposium 2026
Bringing people together from across academia, industry, and government for discussion and debate on…

Keeping creative options open for everyone
How does creative study allow us to express ideas, shape how we see the world, and contribute to vib…

Coworking spaces as informal skill ecosystems for the creative workforce
How coworking spaces have become an increasingly important component of the creative economy.
From Wales to the World: Why International Cultural Policy Needs a Future Generations Lens
Can international cultural policy be shaped by focusing on future generations?
10 facts about Creative Industries growth potential
Discover ten key findings from the report 'High-Growth Potential Firms in the UK's Creative Industri…

Why London is investing in Creative Enterprise Zones
London Mayor Sir Sadiq Khan announces £2.2 million in new funding for Creative Enterprise Zones.

Research resources on Creative Clusters
We’ve collated recent Creative PEC reports to help with the preparation of your Creative Cluster bid…

What UK Job Postings Reveal About the Changing Demand for Creativity Skills in the Age of Generative AI
The emergence of AI promises faster economic growth, but also raises concerns about labour market di…
Creative PEC’s digest of the 2025 Autumn Budget
Creative PEC's Policy Unit digests the Government’s 2025 Budget and its impact on the UK’s creative …