Using online museum collections to study the design of everyday objects
A little greyer?
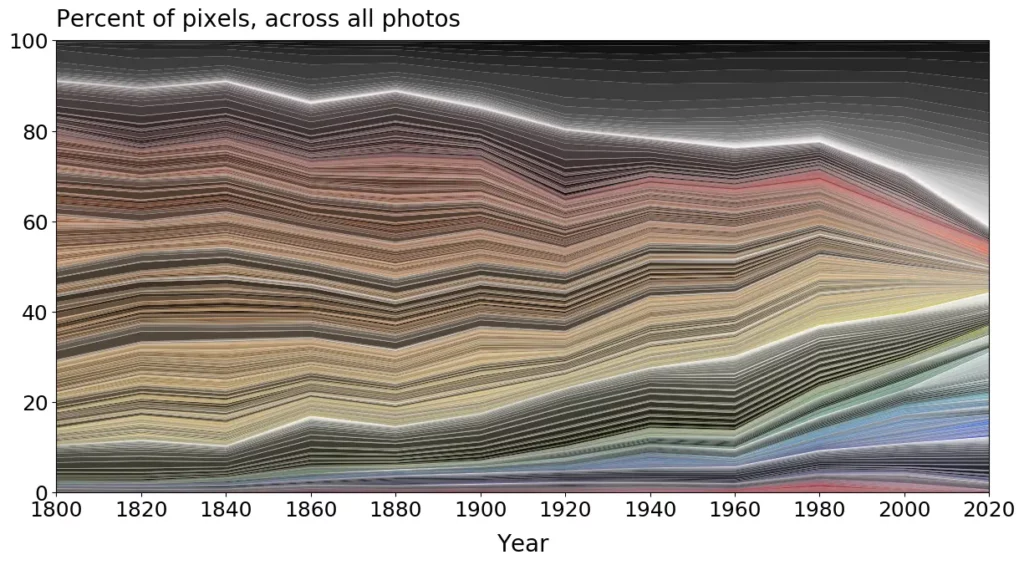
We tracked the colour of objects overtime and found a substantial rise in the use of grey, and a concurrent fall in the use of brown and yellow. These trends likely reflect changes in materials, such as the move away from wood and towards plastic. A smaller trend is the use of very saturated colours which begins in the 1960s.
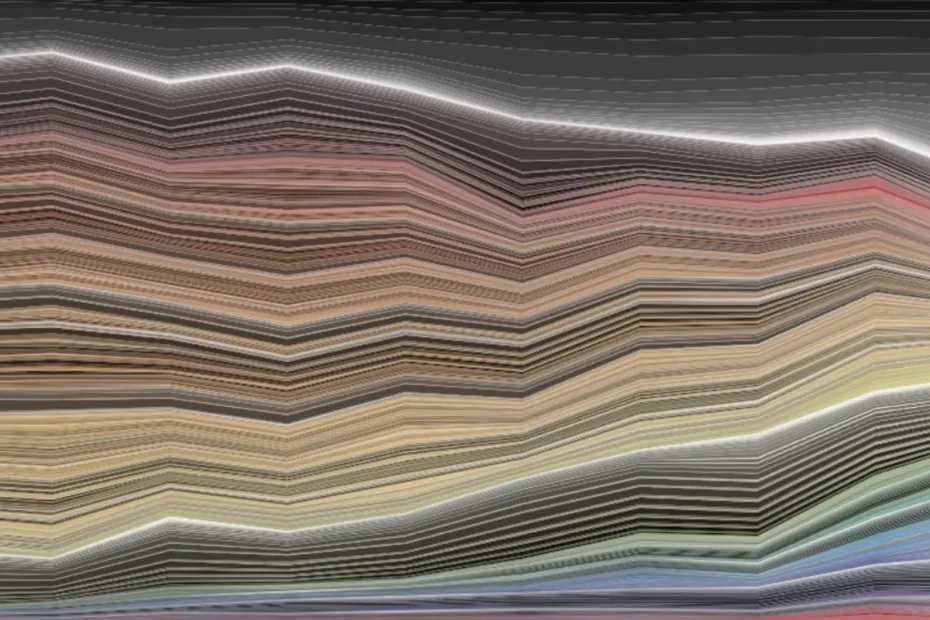
The video below provides a more detailed picture of how colour has evolved. The objects are ordered by their earliest date and each frame shows the mix of colours in overlapping groups of objects.
Each frame shows the 2,000 most common colours amongst a group of 250 objects. One example of an object from that group is also shown. The groups of objects overlap; 10 new objects are introduced and removed with each subsequent frame.
While objects do appear to have become a little greyer over time, we must remember that the photographs examined here are a just a sample of the objects within the collection, and the collection itself is a non-random selection of objects.
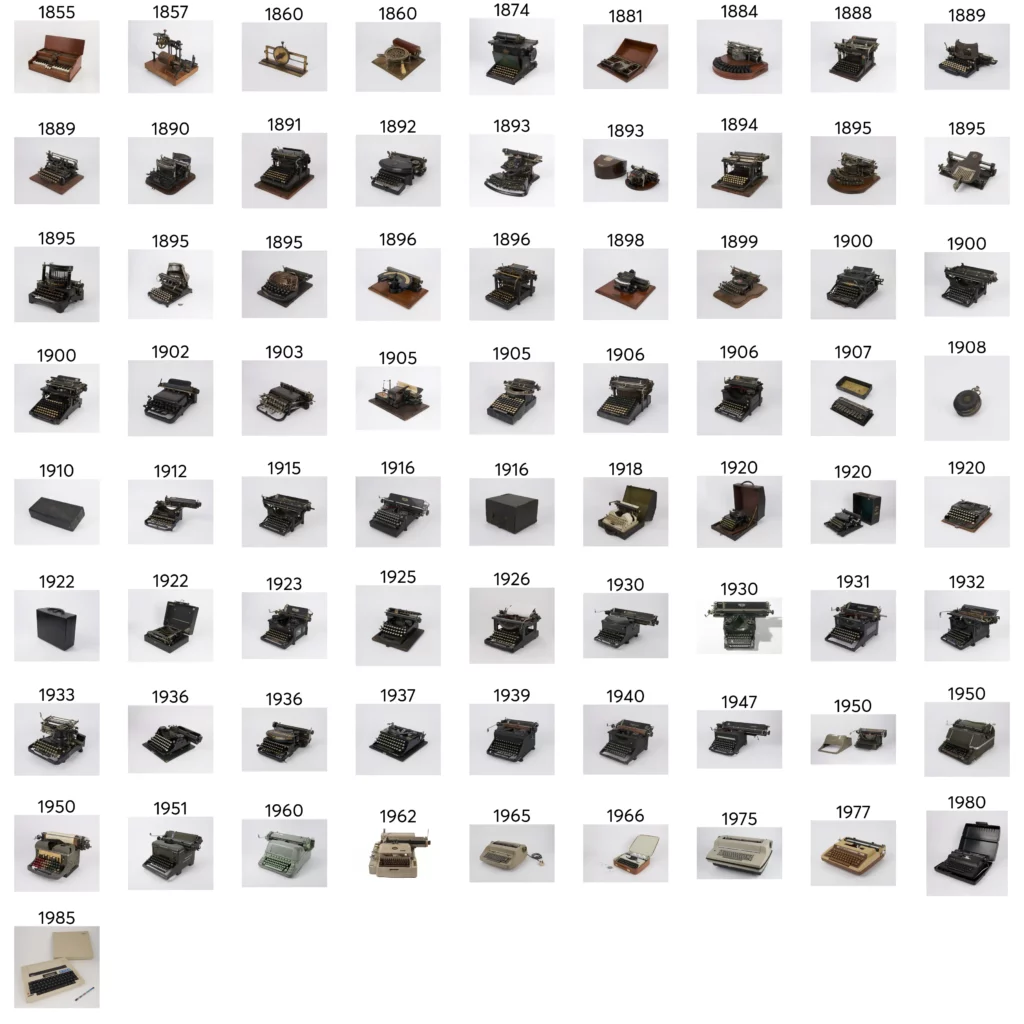
A closer look at telephones
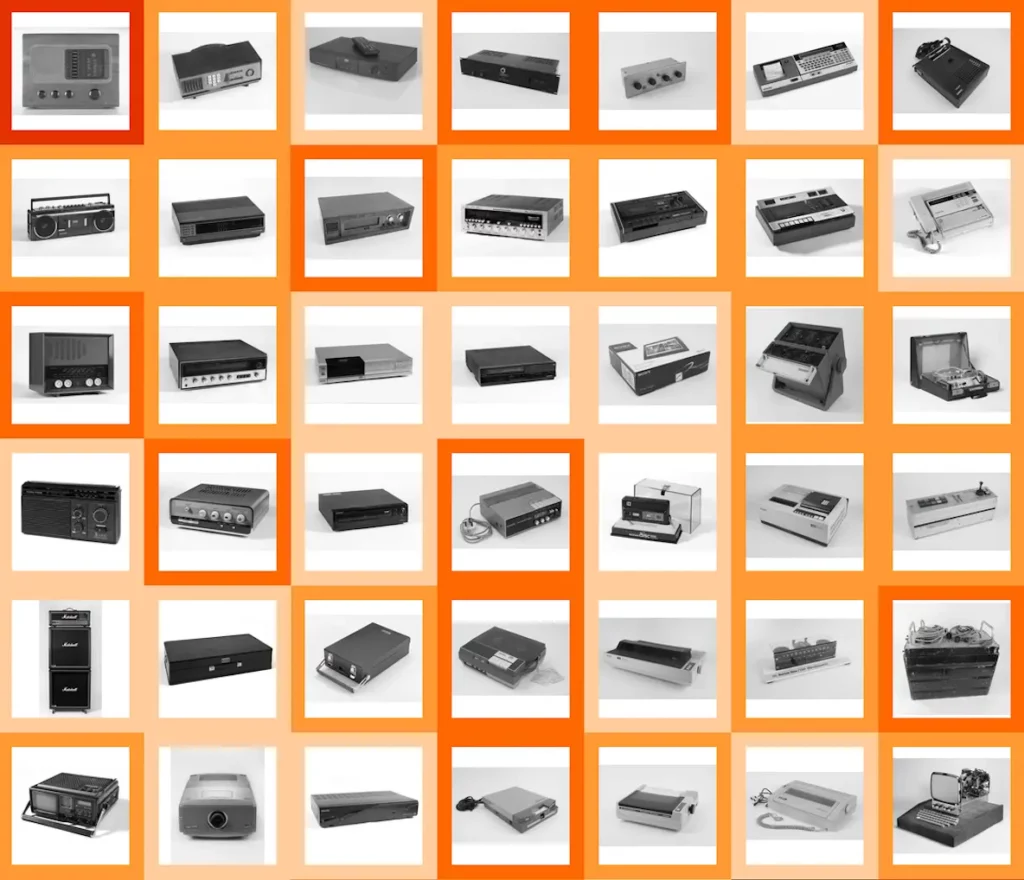
The turn towards grey can also be seen within individual objects such as telephones. The Science Museum Group Collection contains hundreds of phones, dating from the late 1800s to the present day. The video below shows that some of the earliest telephones shared the same greyscale palette that is seen today in many smartphones. The 1960s brought with it a much broader range of colours, and then the ‘greying’ began in the late 1980s, with the introduction of the brick phone.
The five most common colours in each phone are displayed behind the phone and are then added to the chart on the right-hand side.
A bit more rectangular
We also examined the shape of everyday objects within the collection, and found that they appear to have become a little squarer overtime. We used machine learning to automatically group the objects (based only on their photos). Similar-looking objects were placed nearer to each other. The border around each image indicates the earliest year associated with the object.
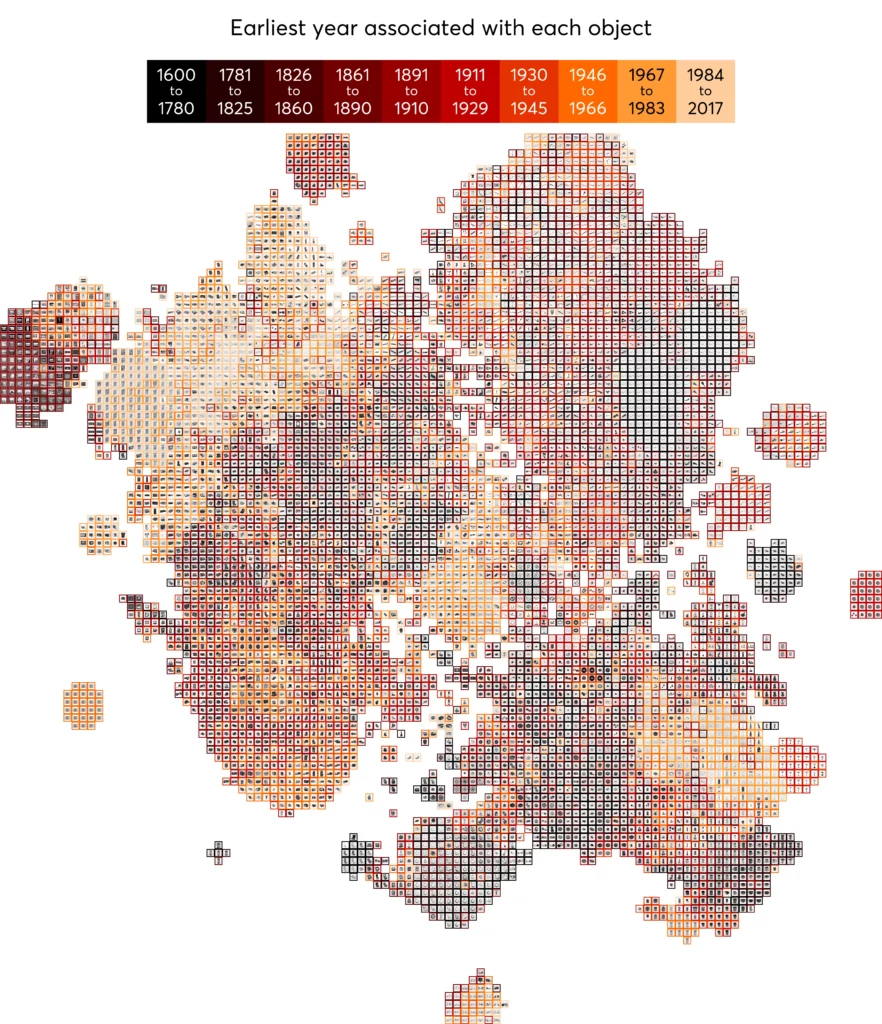
Almost all recent objects (which have pale borders and date from the late 1940s) are found in the north-western area of the map. The objects in this area are all cuboids (or ‘box-shaped’), and range from cigarette packets to televisions, and from mobile phones to computer games.
While the cuboid or box appears to be a dominant shape for recent objects, we discovered two interesting exceptions. The first was the table telephone (found in the middle of the map) which had a much more complex shape than a cuboid, with a curly cord and handset. The second exception was modern translucent objects, which boast a variety of shapes (owing to their decorative purpose and the malleability of their materials).
We also found a small number of objects that were so ‘visually distinctive’ that they formed their own islands in the map. One such island consists almost entirely of typewriters, while another houses ancient Egyptian and Syrian weights. In the case of typewriters, its visible parts have very unique shapes – from the ribbon which is wrapped around spools, to the platten which is cylindrical.
Final thoughts
The Science Museum Group’s open dataset of photographs allows us to learn more about their collection. Our preliminary analysis suggests that everyday objects may have become a little greyer and a little squarer (or ‘box-like’). While only time will tell, it does highlight a challenge for museums who must engage visitors with these ‘black boxes’. Collectively examining objects also allows us to identify and celebrate the most distinctive objects, from typewriters to table telephones. As computer vision methods continue to improve we will be able to extract further insights from online collections and learn more about the objects that fill our lives. For further details on the methodology please see the original article published by the Science Museum Group on Medium in October 2020.
Related Blogs
Measure what matters: Priority pathways and Creative Higher Education
Bernard Hay, Creative PEC's Policy Director, investigates the surprising absence of creative subject…

11 actions for the cultural and creative industries in the age of AI
A guide to help the cultural and creative industries address the rise of AI, from the GCEC.
Creative Resilience in Times of Crisis
Introducing A Global Agenda for Creative Resilience, an 11-point strategic framework for strengtheni…
Reporting from the Creative PEC Research Symposium 2026
Bringing people together from across academia, industry, and government for discussion and debate on…

Keeping creative options open for everyone
How does creative study allow us to express ideas, shape how we see the world, and contribute to vib…
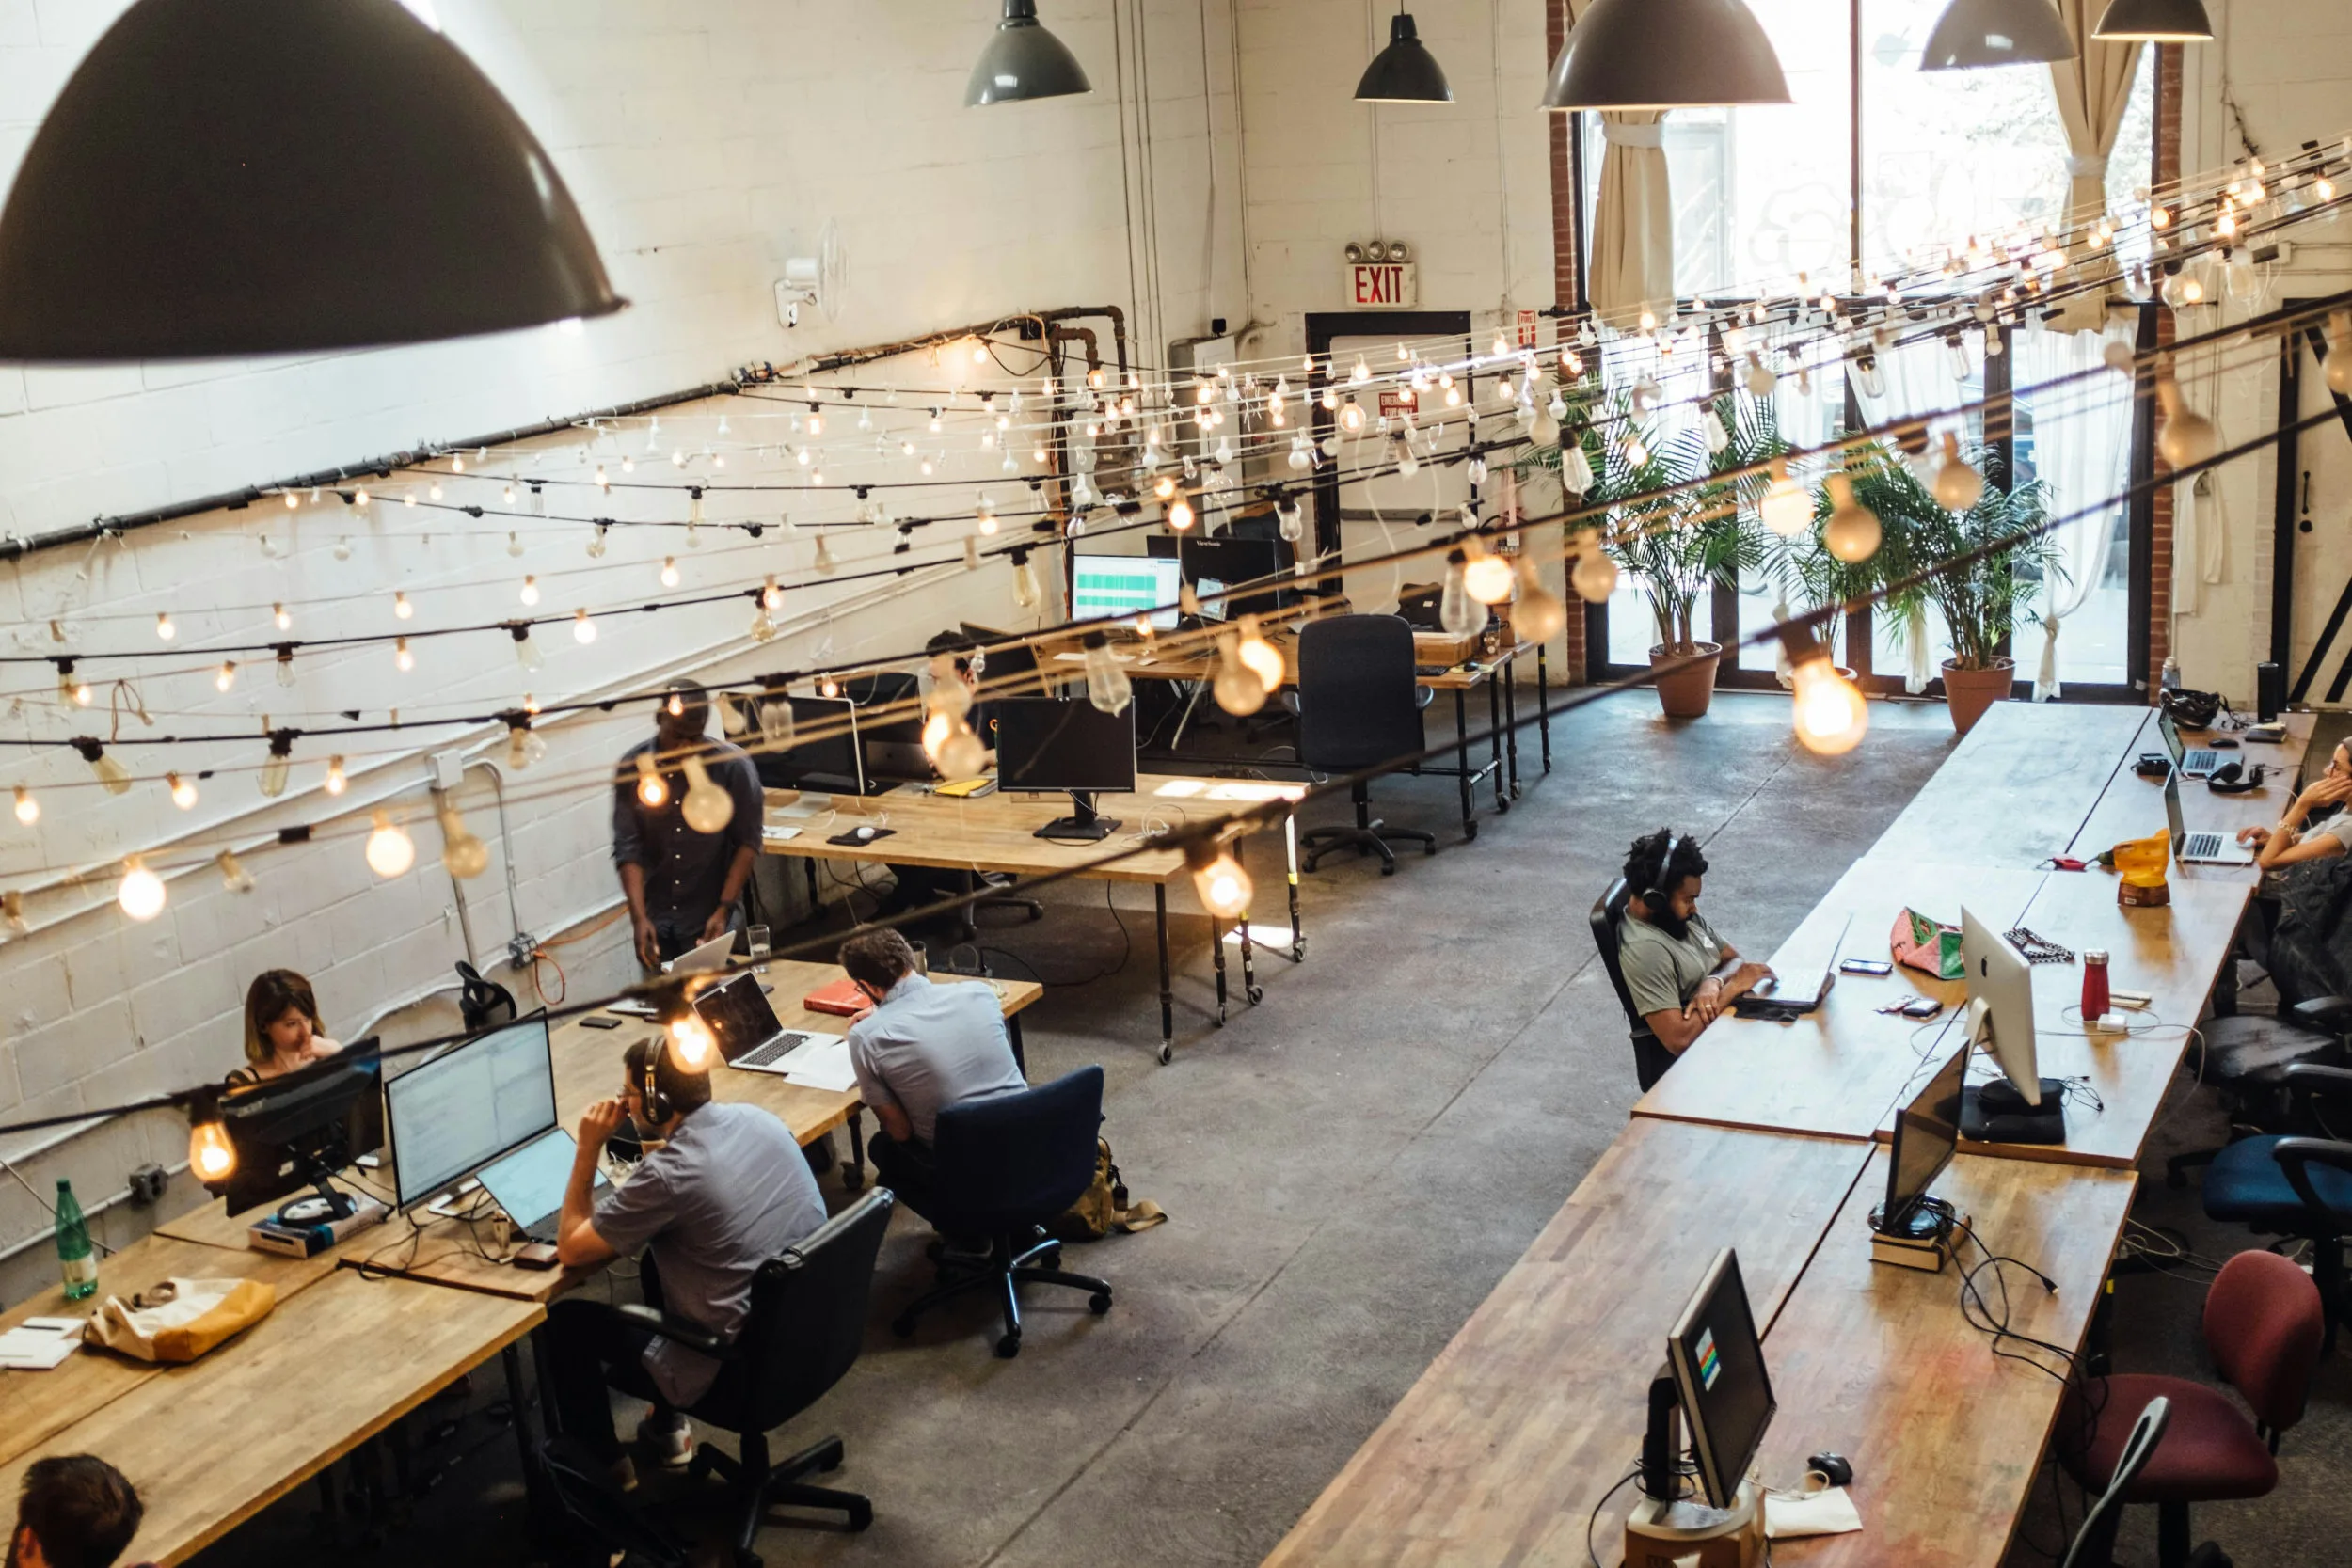
Coworking spaces as informal skill ecosystems for the creative workforce
How coworking spaces have become an increasingly important component of the creative economy.
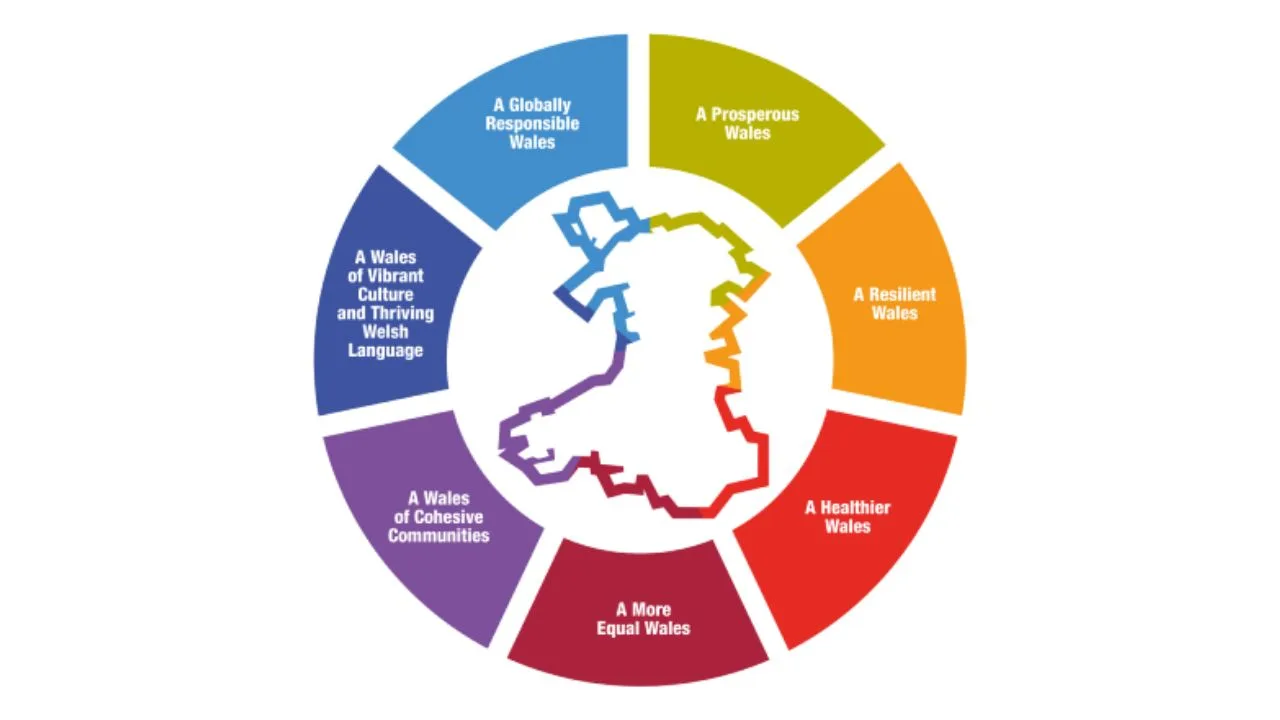
From Wales to the World: Why International Cultural Policy Needs a Future Generations Lens
Can international cultural policy be shaped by focusing on future generations?
10 facts about Creative Industries growth potential
Discover ten key findings from the report 'High-Growth Potential Firms in the UK's Creative Industri…

Why London is investing in Creative Enterprise Zones
London Mayor Sir Sadiq Khan announces £2.2 million in new funding for Creative Enterprise Zones.

Research resources on Creative Clusters
We’ve collated recent Creative PEC reports to help with the preparation of your Creative Cluster bid…

What UK Job Postings Reveal About the Changing Demand for Creativity Skills in the Age of Generative AI
The emergence of AI promises faster economic growth, but also raises concerns about labour market di…
Creative PEC’s digest of the 2025 Autumn Budget
Creative PEC's Policy Unit digests the Government’s 2025 Budget and its impact on the UK’s creative …