

Professor Dave O’Brien, University of Manchester, Dr Peter Campbell, University of Liverpool and Dr Mark Taylor, University of Sheffield
Inequalities in the film industry have been the subject of much media and research scrutiny. Scandals, in the wake of #MeToo, and public campaigns for change, for example #OscarsSoWhite, sit alongside academic research showing huge issues for diversity in the workforce and diversity on screen.
Social class has seen lots of media discussion, but hasn’t seen the same sorts of research as, for example gender or ethnicity. Some of this is driven by data collection issues, particularly in the UK context where social class is not a protected characteristic under UK equality legislation.
Creative PEC has already produced analysis of broad patterns of class origin inequalities in the film and television workforce. However, until recently understanding how class impacts film specifically, for example in funding and on the ‘pipeline’ into the industry, was not possible.
The British Film Institute (BFI) has recently begun collecting data on social class origin of applicants for its Film Fund. In recent research analysis published in the journal Media, Culture and Society, we have used this data that includes demographic information, including social class origins, of those who apply for and receive funds from the BFI Film Fund.
The BFI’s Film Fund offers three types of funding for writers, directors and producers. It supports early-career applicants (the ‘NETWORK’ fund), the development of feature films (‘Development’) and the production of feature films (‘Production’). Film Fund data
Firstly, looking at overall levels of applications, we see a high, and rising, demand for early-career ‘NETWORK’ funds in recent years, but declines in applications for Development and Production.
Table 1: Number of applicants per fund
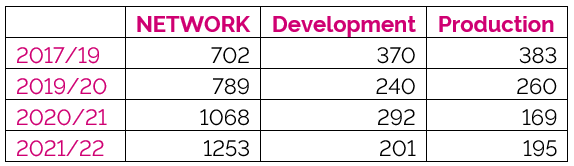
Notes: raw numbers of applicants per fund in each period
The BFI asks for information about parental occupation during the respondent’s childhood as a proxy for social class background. Those occupations correspond to categories in the National Statistics Socio-Economic Classification (NS-SEC) schema. NS-SEC 1 and 2 (such as chief executives or journalists) are labelled ‘managerial/professional’, those from NS-SEC categories 3–5 (such as clerical workers or shopkeepers) are labelled ‘intermediate’; and those from NS-SEC categories 6–8 (such as housekeepers or labourers) are labelled ‘working class’:
As the table below shows, using data from all available years, those from managerial/professional- ‘middle class’- backgrounds dominate all funds and roles.
Table 2: Application rates by role and fund
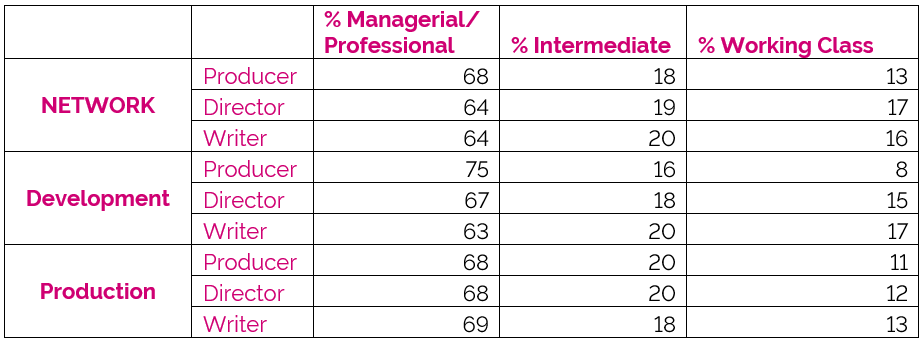
Notes: numbers are the overall percentages by role and fund applying from each social class background group. For example, 68% of applicants for producer roles for BFI NETWORK funding are from managerial/professional backgrounds.
Overall, around 66% of applicants are from managerial/professional backgrounds, compared to 37% of the workforce as a whole in 2022; 39% of the workforce as a whole are from working class backgrounds.
Whilst levels of applications clearly reflect wider inequalities, is the same true for what is awarded funding?
There is some good class news in the NETWORK fund. Writers and directors from working class backgrounds are more likely to be awarded funding in this strand than their professional/managerial origin counterparts. This is despite the dominance of those from professional/managerial origins in the overall numbers of applications.
However, class inequality is clear in the Development and Production funds. Here, applicants from professional/managerial backgrounds are more likely to be awarded funding. This is true for Producers, Directors, and Writers. This holds even when we take into account the over-representation of professional/managerial backgrounds in the overall numbers of applications.
Table 3: Overall success rates by class background
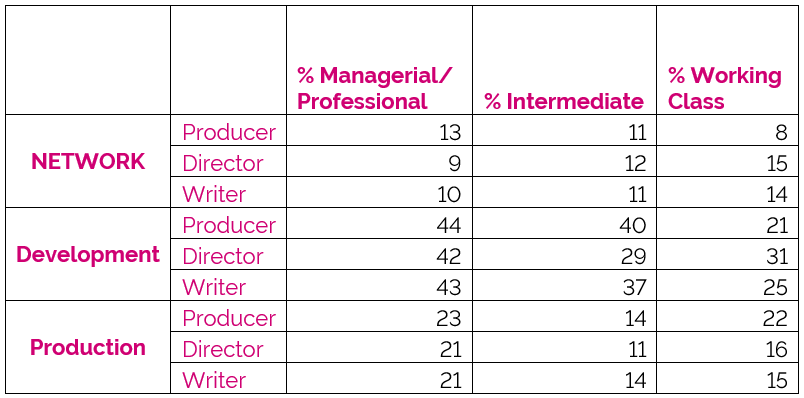
Notes: percentages here are success rates for roles and funds for each group. For example, 13% of applicants for producer roles through BFI NETWORK funding from people from managerial/professional backgrounds were successful, and 87% were not successful.
Analysis of social class can be particularly powerful when it is understood in relation to other demographic characteristics. The final stage of our analysis shows an intersectional perspective, connecting class with gender and ethnicity information in the BFI Film Fund dataset.
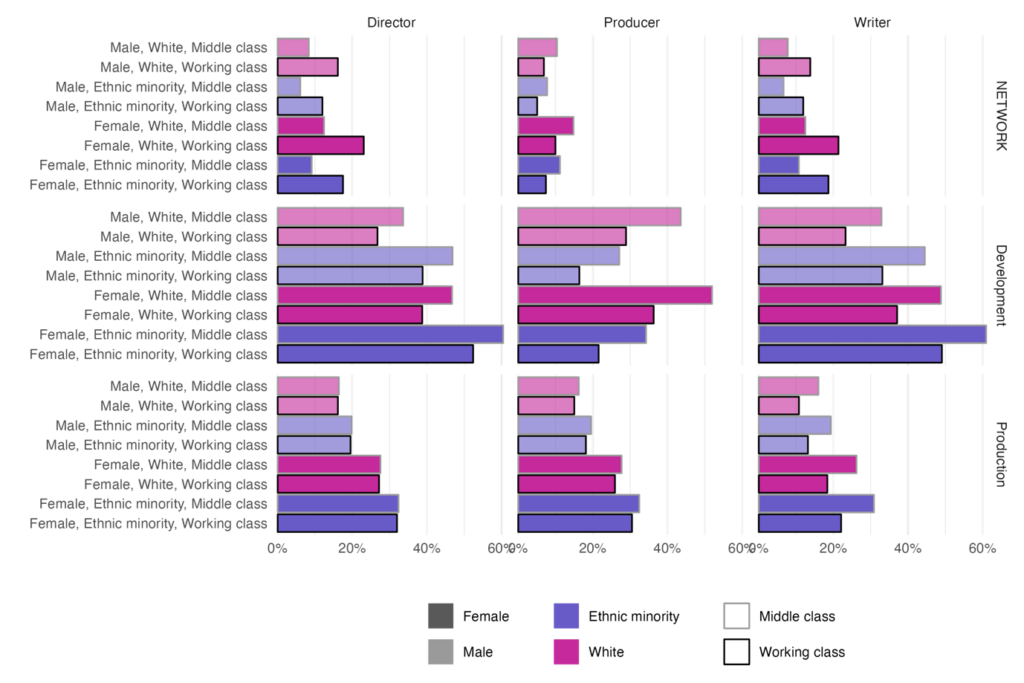
The intersectional picture is complex across the three funds and for Producers, Directors, and Writers. Despite a lower absolute level of application, women are proportionally more likely than men to receive funding for all roles and funds.
There are also fewer ethnic minorities applying to all of the funding streams. Here the picture is complex, with ethnic minorities are slightly less likely to receive NETWORK funding than their White counterparts; ethnic minority directors and writers are slightly more likely to receive Development funding, while ethnic minority producers are significantly less likely to receive Production funding.
When social class is factored into the mix, we see comparatively high rates of success for those from working class backgrounds of any gender or ethnicity. However, Development and Production, which can access more substantive levels of investment, middle class writers and producers are more likely to be funded.
The group least likely of all to receive funding, based on predicted probabilities, are male ethnic minority producers from working class backgrounds applying for NETWORK funding. They have a probability of just 5%, compared with 10% for White men from middle class backgrounds. Overall, the largest differences can be seen among producers applying for Development funding. A White woman from a middle class background has a predicted probability of 52% of receiving funding; for an ethnic minority man from a working-class background, the figure is less than a third of this, at 16%.
Table 4: Predicted probabilities of successful funding given application for eight demographic groups
Data can tell a powerful story about inequality, revealing the extent of the task to make film more diverse. Yet simply demonstrating inequalities is only a starting point, and is no substitute for action and change.
This is a guest blog for the Creative PEC website. Any views expressed are those of the authors who is responsible for all content.
Photo by Gordon Cowie on Unsplash