
From presence to prominence: How can computer vision widen evidence base of on-screen representation
We present a conceptual framework of representation measurements, focusing on representation on-screen. Off-screen inclusion (e.g. commissioning of stories, crew makeup), while important, is not addressed.
Why is the framework needed?
As more diversity data is being collected, we need a clearer sense of how different data compilation methods compare. Data measured from e.g. a survey, a manual counting study, or a computational approach may all aim to capture representation, but each method may capture very different aspects of diversity. Currently, important aspects of representation like prominence or portrayal are often discussed using only qualitative content analysis, when quantitative analysis can really complement the discussion.
We also need to surface the key ethical and logistical considerations of computational methods, if they were deployed to generate more regular data about representation. Making the blind spots and limitations explicit is necessary if these data science methods are to be scaled usefully and responsibly.
Who should use it and how?
The framework is aimed at anyone who is interested in measuring on-screen representation, from media regulators to broadcasters, researchers and film/TV fans. It asks three key questions about the method being used to measure representation.
The framework is most relevant for measuring on-screen groups falling under Equality Act protected characteristics. This follows the convention of existing evidence: e.g. Project Diamond measures six protected characteristics: gender, gender identity, age, ethnicity, sexual orientation and disability. But the framework can also be applied to understand non-protected characteristics like socioeconomic diversity, covered in Ofcom’s annual diversity in television broadcasting reports.
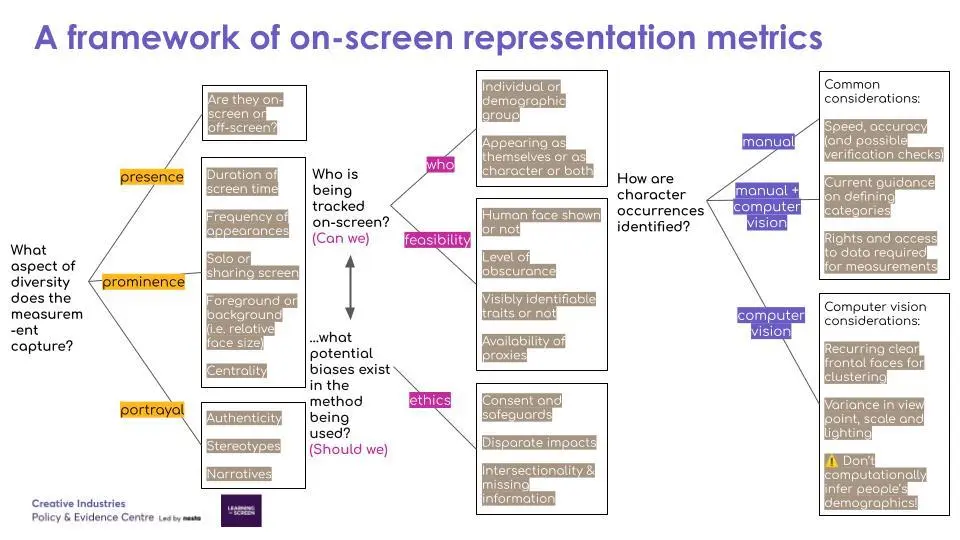
Question 1: What aspect of diversity does the measurement capture?
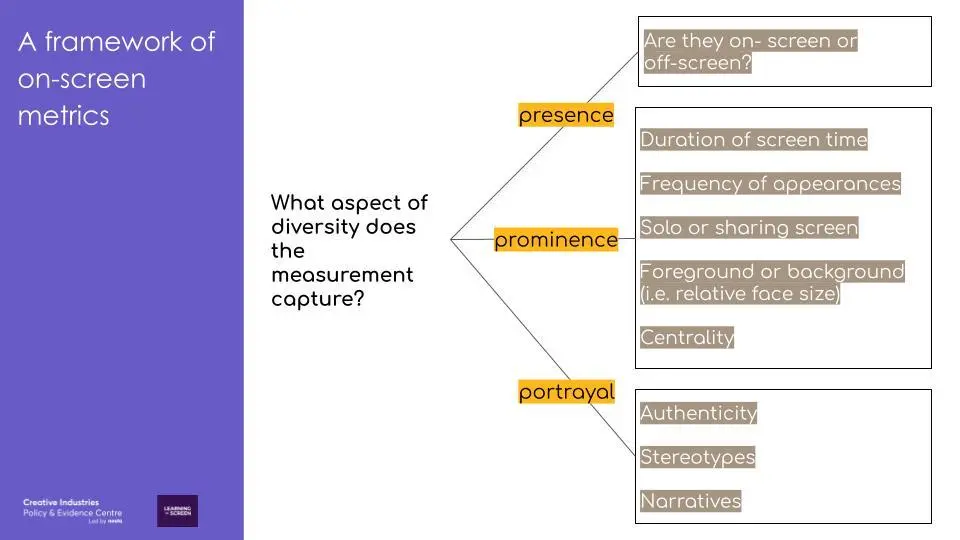
This question helps make explicit the aspect of diversity that is being measured. We think that they generally fall under one of ‘3P’s — presence, prominence and portrayal.
Measures of presence focus on determining whether someone is shown on-screen or not. Currently, most of the regularly collected metrics concentrate on this aspect. However, we should aim to expand beyond presence. For example, we can study characters’ prominence, relative to each other in a programme. Computer vision has potential to contribute here. The last ‘P’ is portrayal. This analyses the authenticity of portrayals, and what narratives and stereotypes the story may be subverting or perpetuating.
How can the 3Ps be captured in metrics? Here are some examples:
- ‘Presence’: the make-up of the cast by gender/ ethnicity, etc.
- ‘Prominence’: duration of screen time; likelihood to appear as a solo face on screen; relatively more central or influential characters.
- ‘Portrayal’: emotion of faces or the words by a character; likelihood of appearing next to particular objects like weapons or drinks.
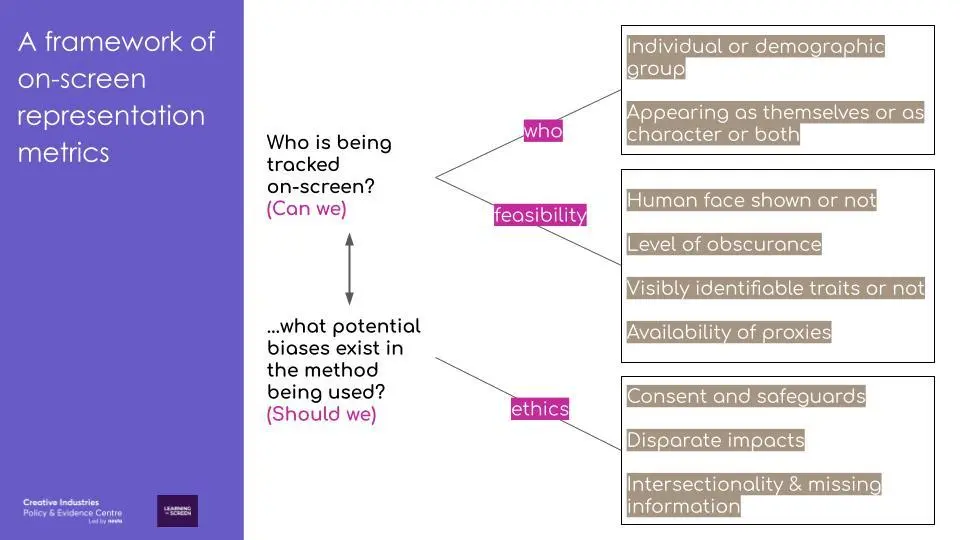
Question 2: Who is being tracked on-screen, and what potential biases exist in the method being used?
The second part of the framework raises the considerations around whether tracking a group is possible with a purely visual approach, and what potential biases and ethical concerns arise. We group the considerations under feasibility (can we) and ethics (should we), as the two should be considered together.
Under feasibility, key considerations include if a human face is shown (e.g. it could be computer-generated), the level of occlusion (e.g. a mask may be covering the face or a character may be speaking off-screen), whether a demographic group exhibits identifiable traits using just the visual of faces, and the availability of proxies (e.g. a regional accent).
Under ethics, there are considerations specific to character monitoring. The perpetuation of bias is an especially key concern: researchers have repeatedly found that darker-skinned females have lower accuracy rates in many commercial face detection models. There needs to be the utmost careful deliberation of the fairness and transparency criteria before any models are used, alongside systems for verification and auditing.
Conventional diversity-form categories do not map well to categories in labelled data. This is especially true for demographic traits like ethnicity and non-visible disabilities. For example, existing public datasets of faces only tend to have three to four types of race labels. While there are datasets that attempt to collect more balanced samples of faces across gender, skin colour and age, a perfectly balanced dataset does not solve all ethical issues. Demographic inference using classification assumes clean categorisations, when in reality demographic identities are heavily laden with social context.
It is also important to acknowledge whether or not it is possible to capture intersectionality, with evidence identifying the need for more insights into the intersectional dynamics of underrepresented groups.
To minimize the chance of reinforcing unfair biases, we advise against computationally inferring characters’ or people’s demographics. But computer vision can still be usefully applied to identify character occurrences, which is explored in the third part of the framework.
Labelled data refers to a group of samples that have been tagged with one or more labels, e.g. images of faces labelled with attributes.
Intersectionality is the interconnected nature of social categories. An example from an analysis of the BFI Diversity Standards is to understand how race/ethnicity, socio-economic background disability and other underrepresented groups intersect within gender.
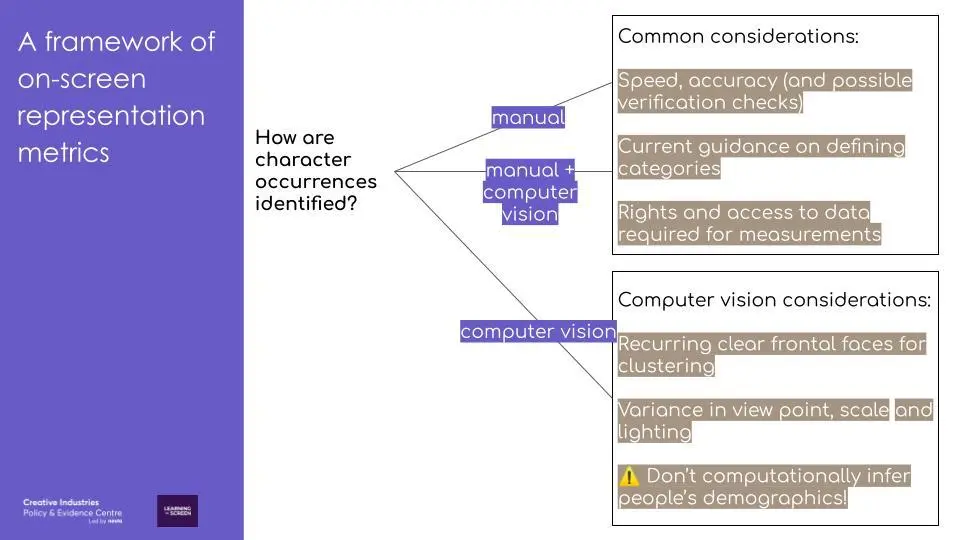
Question 3: How are character occurrences identified?
The last part of the framework helps determine the most appropriate method. There are considerations common to manual and computer vision approaches: e.g. speed and accuracy, possible verification checks, guidance on defining categories, and rights and access to the data required.
In selecting the most appropriate method, there is often a trade off between accuracy and speed. Currently the most sophisticated face detection models require longer processing times. That said, even ‘slow’ face detection models will still be quicker than manual annotation by researchers. The faces detected with a program can be clustered to identify occurrences of the same character, but the optimal model parameters will vary by the type of programme that is being analysed.
There is a growing body of research on computer vision and faces, especially around algorithmic fairness in recent years. But much more research is needed on when face detections are missed and the causes of this, as well as the factors that cause different faces to be mistaken as the same face. A programme that has many recurring frontal faces will allow the ‘tracks’ (see below) to be more easily clustered, allowing the identification of most to all appearances of the same character. This makes applying computer vision to identify character occurrences easier. But programmes that have higher variance in viewpoint, more crowds (smaller faces) and darker lighting, would give less reliable clustered faces. Finally, in the longer term, technical recommendations (e.g. downsampling the frame rate from the broadcast 25 fps) and data standards specific to representation metrics can be developed.
In summary, the framework we propose for measuring on-screen representation can help to make a diagnosis of how computer vision can be best applied to measure on-screen representation. The key takeaways are:
- Moving from presence to prominence and portrayal, e.g. via collection of character prominence data with computer vision, can bring new value and prompt new questions.
- Computer visions models can be applied to speed up the identification of character occurrence, but it shouldn’t be used to infer demographic attributes.
- Interdisciplinary efforts – including computer science, sociology (media analysis), digital humanities, and ethics/data justice – are key to thoughtfully deploy computational methods to generate richer and more regular data about representation.
In the next blog, we demonstrate how computer vision can be used to measure the relative prominence of people on screen.
Photo by Leticia Ribeiro
Related Research Reports

The impact of overseas mergers and acquisitions on UK video games industry
A new scoping study on the economic consequences and potential market failures The BFI’s Resear…

Post-Brexit migration and accessing foreign talent in the Creative Industries
The UK’s departure from the EU has changed the way that British firms trade and work with Euro…

12 facts about the UK’s international trade in creative goods and services
Worldwide exports of creative goods exceeded 500 billion USD in 2015, with a 150% increase since 200…

The migrant and skills needs of creative businesses in the UK
This report details the results of a survey of employers commissioned by the Creative Industries Cou…

Skilled migration and the UK’s creative industries
This report argued that to support the growth of the creative industries, we need to ensure that the…

Creative Economy Employment in the US, Canada and the UK
This report measured employment in the creative economies of the US, Canada and the UK. It provided …

Creative economy employment in the EU and UK: A comparative analysis
This report compared the size and growth of the EU’s creative industries on a consistent basis. It a…