Insights from the nine-week study into consumers cultural consumption habits
This is the latest release of the data from a survey of people’s consumption of culture through lockdown, commissioned by the PEC and the Intellectual Property Office (IPO), and carried out by Audience Net.
The study aims to measure the impact that lockdown has had on the creative industries, by asking people about their habits of cultural consumption, such as the amount of TV they watch or how they listen to music, and whether it has changed in 2020.
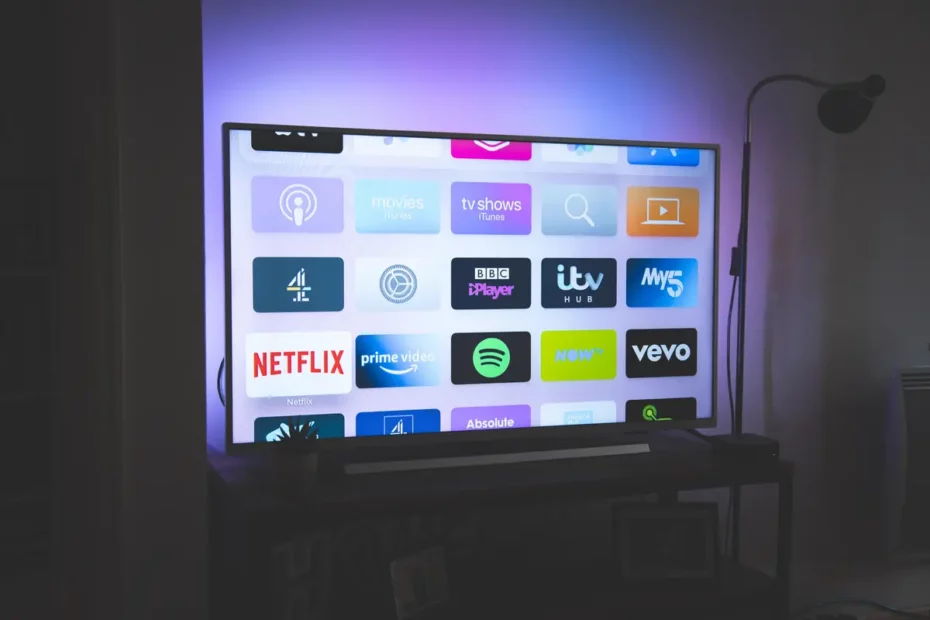
The insights provided by the survey show how important culture is for people, especially those who are physically isolated by stricter local lockdown restrictions. The survey also illustrates the impact that the lockdown has had on the creative industries. While people have spent time enjoying film, video games, music and books, they have spent the most time watching television. Within some sub-sectors, such as publishing, we can delve even deeper and see that audiobooks have been the most popular device for reading, above books, e-books and magazines.
PEC Director Hasan Bakhshi goes into more detail about some of the findings from the survey and what they could mean.
Overview of the Waves 1 to 9 of the Survey
The sudden outbreak of COVID-19 and the UK’s period of lockdown has changed the way we experience cultural content – from film, to live music, and art exhibitions. Movement restrictions leading to more time in the home, the mental wellbeing consequences of social distancing and the huge economic uncertainties, disrupted the way that the public accessed digital content during the lockdown period.
Monitoring these disruptions was critically important to understand the impact that the crisis has had on the Creative Industries, like film, TV, music, video games, publishing and theatre. These sectors generate billions of pounds of value added for the UK economy through physical engagement with consumers.
The first part of the survey, referred to as waves 1 to 6, was carried out over six weeks from April to May, when the UK was in a full national lockdown. The national lockdown ended on July the 4th, although local lockdown restrictions remained in some places, such as Leicester. There were then three further waves of the study, referred to as 7-9, carried out in July, August and September, during which some parts of the UK were in local lockdowns at various points.
We have published the survey data and analysis for all of these periods (dates covered by the survey):
- Wave 1 (2nd -12th April)
- Wave 2(13th – 19th April)
- Wave 3(20th – 26th April)
- Wave 4 (27th April – 3rd May)
- Wave 5(4th – 10th May)
- Wave 6 ( 11th -17th May))
- Wave 7(6th – 12th July)
- Wave 8 (3rd – 9th August)
- Wave 9 (14th- 20th September)
This report is an analysis of the data from wave 9 of the survey, using a sample of 1000 people, and covers the week 14th-20th September. This period saw new local lockdown systems come into place in some regions in England, such as in the North East, while other areas remained relatively open. There were also differences in lockdown restrictions between the four nations, although because of the smaller sample size there are not enough observations in those nations to look at them separately and report meaningful numbers.
As a result, the data is useful for examining how variations in lockdown restrictions between areas in England have impacted the consumption of culture and people’s wellbeing and happiness.
Five key findings from Wave 9
1) Across the whole survey, we can see that some long term trends, such as the decline in downloading in favour of streaming content, were accelerated.
2) One clear though not particularly surprising finding is that people in local lockdown areas watched more television and films than those in less restricted areas.
3) At the same time, the end of lockdown saw a considerable uptick in physical purchases of music and video games, indicating that the retail experience is still important to many people.
4) The relaxing of lockdown measures hasn’t had a noticeable effect on people’s reported wellbeing. Reported anxiety levels were highest at the start of lockdown, falling over the next few weeks, and remaining stable even as shops, pubs and restaurants reopened and people could more easily meet friends and family.
5) As you might expect, there was an increase in those who are working inside the home and those who say they are working from home more. The proportion of people who used video conferencing software, like Zoom, for work was highest in wave 9 at 31%, possibly the result of furlough schemes coming to an end and people returning to work.
Following a trend shown over the past five years, streaming was more common than downloading during lockdown for all three content categories we looked at (music, film and TV). In week one, nearly double the proportion of people streamed content than downloaded it.
Across the weeks, interestingly, all three categories saw peaks in both streaming and downloading in week two. After this, there was a decrease in downloading, falling below the levels in week one for music and film. While streaming also declined post the peak, it was comparatively more stable. Younger age groups tended to be more engaged than other age groups in downloading and streaming.
Illegal vs legal access to content
We compared numbers of people who had used at least one illegal source in the last three months to access content pre-lockdown with those doing so during lockdown. Those consuming illegal content either remained consistent or decreased in most categories. Exceptions to this were video games and music downloading which both had increases. It’s important to note that this is the proportion of people using illegal means, rather than the amount downloaded illegally overall (which industry intelligence has suggested may be significantly higher).
In terms of weekly consumption, downloading music generally had the highest proportion using illegal sources, while music streaming had the lowest. Many categories showed a similar pattern where the levels of infringement were highest in week one and then declined over the course of the study. The highest volume of content consumed in all categories was in the first week of the survey, after which it tended to decline. For some categories, this was also the peak in terms of the volume of illegal content accessed. More specifically, the illegal volume tended to decline from week two onwards.
An uptake in newer forms of cultural content in early weeks
In the study we also looked at non-traditional cultural activities such as playing multiplayer video games, watching esports or watching live streams, watching filmed performances of theatre, concerts or dance online, and looking at art online.
About four in ten had ever played online multiplayer video games before the pandemic and roughly three in ten had ever watched esports or live streams of people playing video games. Those who played games or watched people playing them were more likely to be male and younger (aged 16-34). These video game enthusiasts were consistent in their levels of consumption across the six weeks of the study.
Approximately half of respondents had ever watched filmed performances or looked at art online in week one, with around a fifth of those having started engaging with each activity since the pandemic. While weekly engagement with the activities was slightly higher earlier on in the study, it generally sustained.
Physical purchasing
At the start of the study, physical products such as CDs/vinyl and DVDs/Blu-Rays was the least common method of access by some way. However, lockdown appears to have encouraged more people to make physical purchases. While this method remained somewhat behind other means of access, there was a notable uplift for all categories.
For books, magazines and audiobooks, physical purchasing became as common as (and at times more common than) digital consumption. Encouragingly for retail in the creative sector, the increase in physical purchases was largely driven by younger age groups.
About the study
The PEC and the IPO commissioned AudienceNet to design and conduct a weekly nationally representative survey of 1000+ consumers aged 16+ on how they engage with digital cultural content in the home. Six weeks of data were collected across six consecutive weeks (9th April to 24th May 2020), with further data collection in July, August and September 2020. As well as asking many questions drawn from the IPO’s Online Copyright Infringement (OCI) Tracker, conducted on nine occasions since 2010, enabling some historical comparisons, the survey asks about time spent engaging with different content categories and about impacts of the COVID-19 pandemic, including wellbeing. The study builds on research in the PEC’s area of work in Intellectual Property, Business Models, Access to Finance and Content Regulation, led by PEC researchers from the University of Glasgow.
We were unfortunately unable to include radio or podcasts in the study as there were no questions about these content categories in the OCI Tracker Survey that it was based on. We have gathered data about podcasts and radio from week 6 of the study, which features at the end of the week 6 report. We are unable to compare this to previous years, however we hope it is still useful for anyone interested in radio and podcast consumption.
Find out more in the full report and learn more about the study in the blog from Hasan Bakhshi, Director of the PEC.
Published 26 November 2020
Photo by Siddharth Bhogra on Unsplash
Related Policy Briefings
Harnessing the growth potential of createch
This insights paper summarises existing evidence on the present opportunities and challenges in crea…
Policy Brief: Creative Industries Employers’ Perspectives on Skills Initiatives: 2025
Overview The Government’s new Industrial Strategy sets a long-term, sector-focused approach to skill…
Policy Brief: Migration in UK Creative Occupations and Industries
Overview The UK’s creative industries are internationally oriented, a fact that’s reflected in its e…
Policy Brief: Arts, Culture and Heritage: Recent Trends in UK Workforce and Engagement in England
Overview Five years after the Covid-19 pandemic, engagement and employment in the arts, culture and …
Policy Brief: Foreign Direct Investment in the UK’s Creative Industries
Read the Policy Brief based on the most recent State of the Nations Report on FDI.
Policy Brief: Insights from the Northern Creative Corridor Workshops Sprint
The Northern Creative Corridor is an initiative aimed at connecting creative clusters across Norther…
Policy Brief: International Trade and the UK Creative Industries
This policy brief examines international trade in the UK creative industries. Drawing on our UK Trad…
Policy brief: Audiences and Workforce in Arts Culture and Heritage
This policy brief uses census data to provide, for the first time, a comprehensive analysis of audie…
Policy Brief: Transitioning to Sustainable Production across the UK Theatre Sector
This policy brief outlines recommendations for transitioning to more sustainable theatre production …
Authors’ Earnings in the UK
This policy briefing sets out areas for possible policy action, proposed by the researchers at CREAT…
Television production, international trade and pressures to consolidate
The UK television production sector is one of Britain’s leading creative export sectors. This briefi…
Three ways to support growth in the creative industries
Three ways to support growth in the creative industries The Creative Industries are an economic powe…
Policy briefing: Creative industries innovation in seaside resorts and country towns
This policy brief is based on a PEC Discussion Paper: Creative Industries Innovation in Seaside Reso…
Policy Briefing: R&D in the Creative Industries
The creative industries are one of the fastest growing sectors of the UK economy. One in eight UK bu…
A global agenda from the Global Creative Economy Council
The GCEC's contribution to the United Nations 2021 International Year of Creative Economy for Sustai…
The birth of neo-regulation. Where next for the UK’s approach to platform regulation?
A new era of tech regulation is about to begin. However, planned legislation is leading to a tension…
Placemaking, Culture and Covid
In September 2021, we consulted a Panel of our Industry Champions on their experiences of …
The Creative Industries in the UK’s Export Strategy
This brief is based upon the findings of our latest research into the features and barriers facing t…
How to design a creative higher education system that supports economic needs
As the UK emerges from the COVID-19 pandemic, the Government is faced with important policy decision…
Creative places: Growing the creative industries across the UK
This is in part because of the economic importance of the sector: one in eight UK businesses are par…
