The impact of COVID-19 on the creative industries, and particularly on the cultural sector, has been significant. Live performance venues and museums and galleries have been forced to close their doors for long or indefinite periods, films and television programmes have had to put a halt on production, and self-employed creatives have experienced immense job instability. However, given the pace of change, and limited data availability, it has been difficult for policymakers and industry to understand the exact scale of the pandemic’s impact on employment within the sector.
That is why the PEC and the Centre for Cultural Value are looking to understand what has happened to employment in the creative industries and to creative occupations since lockdown, by using Labour Force Survey (LFS) data from the Office for National Statistics (ONS).
In the six months following the beginning of lockdown, we have seen:
- A collapse in working hours across the creative industries
- 55,000 job losses (a 30% decline) in music, performing and visual arts
- Significantly higher than average numbers of people leaving creative occupations compared to previous years
This is clear evidence of the existence, and the scale, of a jobs crisis. This blog provides detail from this analysis, looking at job losses for creative occupations, the creative industries as a whole, and then specifically for the cultural sector. It also examines the impact that lockdown has had on the number of hours worked by those who did continue to be occupied in the sector.
Creative occupations
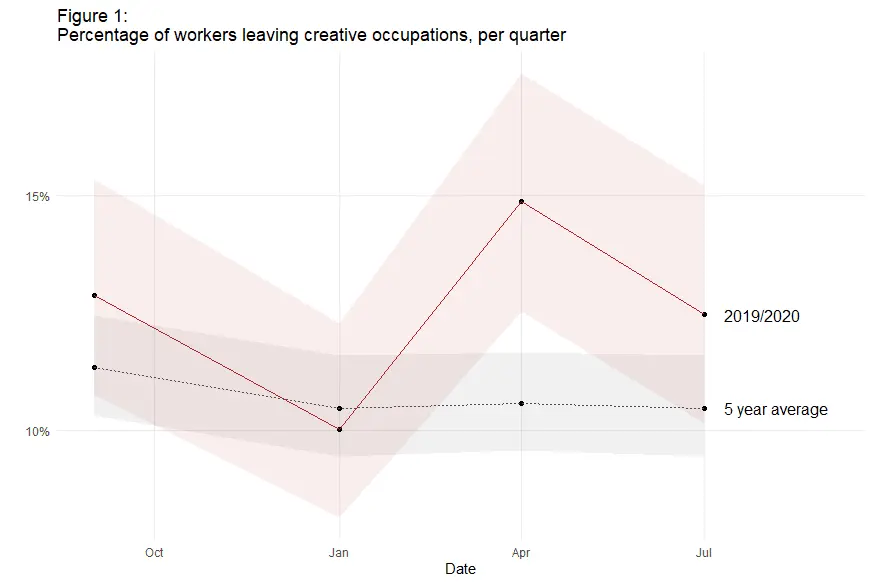
Figure 1 shows two things. The five year average proportion of people leaving creative occupations in each quarter; and the proportion leaving in each quarter between Q4 (October-December) 2019 and up to Q3 (July-September) 2020. The comparison allows us to see how unusual the 2020 employment patterns are.
Creative occupations include many jobs in the creative industries, for example writers, film makers and game designers, but also people doing creative roles in other industries such as designers working in manufacturing companies.
Using the ONS dataset, we found that 15% of people who worked in creative occupations in January-March in 2020 were no longer working in creative occupations in April-June (see figure 1). This is significantly greater than between the same period in the previous five years, where on average we see around 10.5% of creatives leave the sector.
We also found that the percentage of workers who left creative occupations between April to September in 2020 was higher than normal, at 12.5% compared with 10.5% – although in this case the difference is not statistically significant.
Of those who reported having left creative occupations between Q1 (January-March) and Q2 (April-June) around two thirds (69%) were now working in other occupations, while 10% of those who left creative occupations were classified as unemployed.
Creative industries
We also used the ONS data to look at the experience of the creative industries as a sector, as distinct from creative occupations. The ‘creative industries’ includes those who work in what are termed ‘non-creative occupations’ within the wider sector, for example hospitality staff working in museums, but does not include those working in creative roles in other sectors. For workers in the creative industries we saw a similar pattern to those in creative occupations, although the numbers who left the creative industries were smaller in both percentage terms and as a raw number. Approximately 110,000 people left the creative industries between Q1 (January-March) and Q2 (April-July) in 2020, around 8% of workforce.
Cultural sector
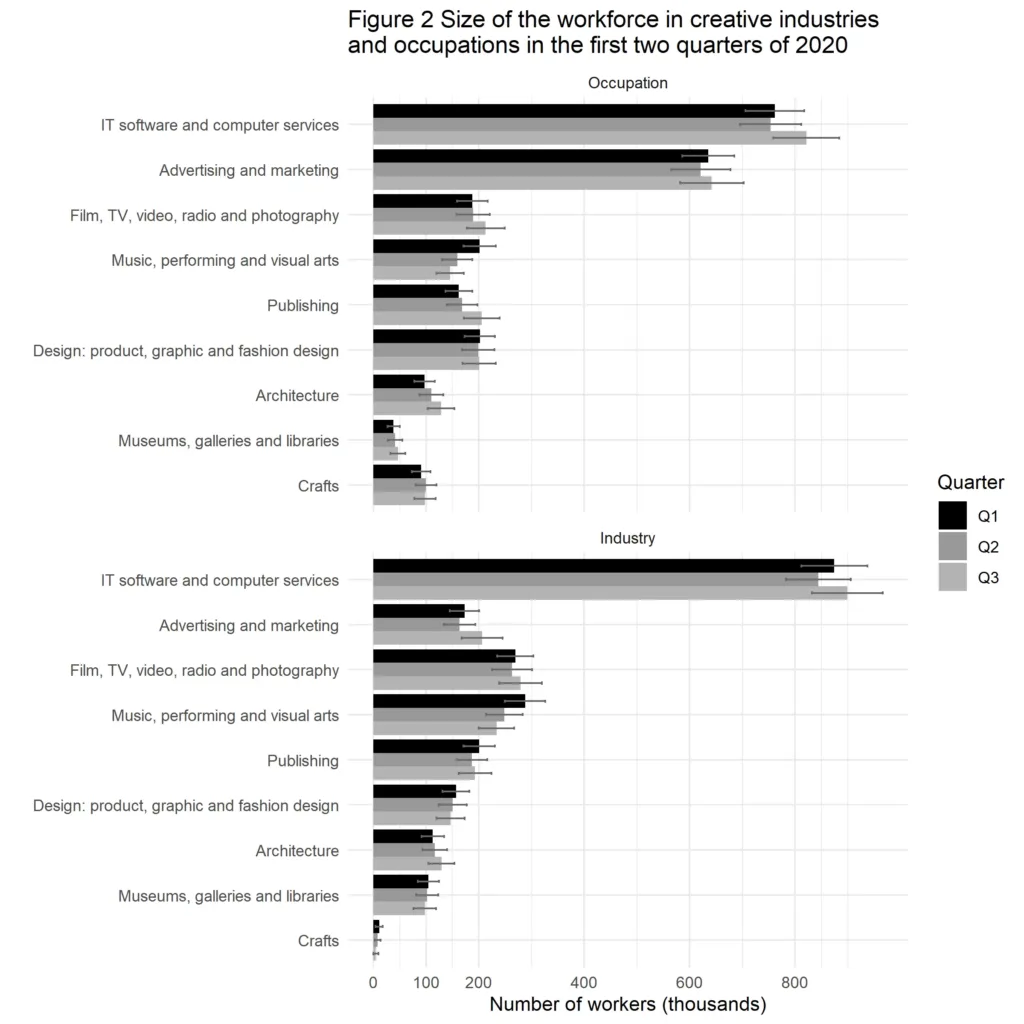
When we looked in more detail at specific sub-sectors in the creative industries, or occupational groups – such as publishing, architecture, and crafts – we found that for most of the creative industries and most creative occupations, there have not been large changes in the number of workers across the first three quarters of 2020 (figure 2).
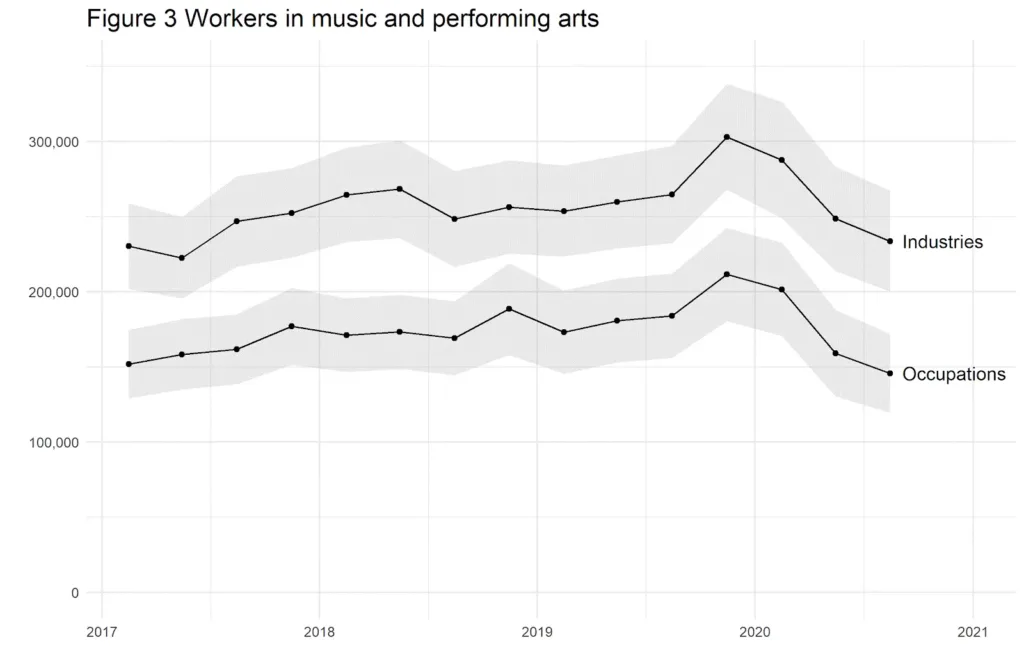
However, the shift in numbers working in music, performing and visual arts occupations is clearly significant. The number of workers in these occupations dropped from around 200,000 in January-March to around 160,000 in April-June and then again to around 145,000 in July-September, a decline of almost 30% since pre-lockdown. When we looked at it from the industry-wide perspective mentioned earlier, rather than an occupational perspective, we found similar results.
This is a particularly important finding as over the last few years the number of people working in music, performing and visual arts has increased, albeit with some variation in number from month to month (see figure 3). The post-lockdown decline clearly breaks this pattern.
Impact on the hours worked by people in creative jobs
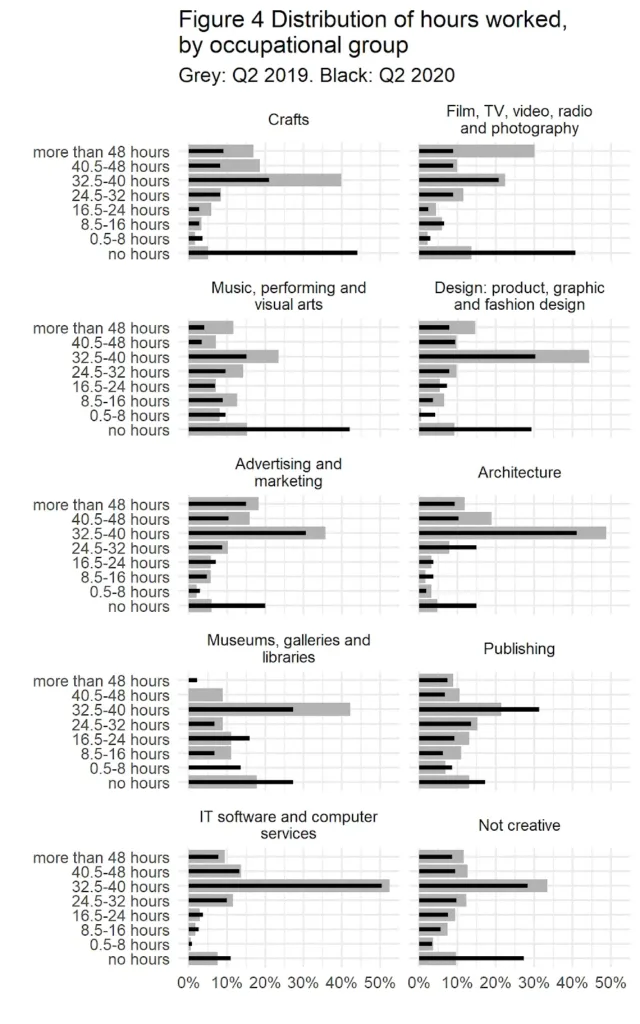
Even where we didn’t find evidence of high levels of job losses, we found that since lockdown began, creative occupations have seen a significant reduction in the average number of hours worked a week. Figure 4 shows the change in the number of hours worked by people in each of the creative occupational groups, comparing April-June in 2019 with April-June in 2020 in order to make sure the differences observed are not just due to seasonal variations. This reveals the substantial increase in the number of people working zero hours in the previous week.
The data also showed us that the reduction in hours has not fallen evenly across the creative industries – those working in crafts, film, TV, video, radio and photography, music, performing and visual arts, and design are the most severely affected.
Moreover, the latest, July-September 2020, data shows that whilst there was a slight reduction in the percentage of workers working zero hours in this latter part of the year, the average number of hours worked were still far below pre-lockdown levels.
Conclusion and next steps
Our initial findings show that workers in the creative industries have been hit hard by the COVID-19 pandemic and lockdown. Moreover, with a collapse in the number of hours worked and large numbers of job losses, the cultural industries and occupations have been hit especially hard.
There is much more research to do to fully understand the implications of this. For example, we need to understand the impact of these job and hours reductions on specific demographic groups. That is why this piece will be the first in a series from the PEC and the Centre for Cultural Value examining the data on job losses over the past year.
It is also important that we look beyond the data and listen to the experiences of people working in the sector over the pandemic, which is why a key part of this project will develop case studies for specific institutions and places as well as document the stories and experiences of creative workers.
Footnotes
1. This is approximately 260,000 people (95% confidence interval – 210,000 to 310,000) which is (statistically) significantly higher than the estimated 170,000 (130,000 to 210,000) people who were newly working in creative occupations in Quarter 2, indicating that the total number of people working in creative occupations has declined.
2. Although these numbers come with some uncertainty, as our data come from a sample of the population, the confidence intervals on the graph do not overlap. This means that we can be confident that more people have left the creative industries than would normally be expected at this time of year.
3. Defined as people without a job who have been actively seeking work in the past four weeks and are available to start work in the next two weeks.
4. This number is only those who left the creative industries and not the net change in size of the workforce.
Related Blogs
Why London is investing in Creative Enterprise Zones
London Mayor Sir Sadiq Khan announces £2.2 million in new funding for Creative Enterprise Zones.
Research resources on Creative Clusters
We’ve collated recent Creative PEC reports to help with the preparation of your Creative Cluster bid…
What UK Job Postings Reveal About the Changing Demand for Creativity Skills in the Age of Generative AI
The emergence of AI promises faster economic growth, but also raises concerns about labour market di…
Creative PEC’s digest of the 2025 Autumn Budget
Creative PEC's Policy Unit digests the Government’s 2025 Budget and its impact on the UK’s creative …
Why do freelancers fall through the gaps?
Why are freelancers in the Performing Arts consistently overlooked, unseen, and unheard?
Insights from the Labour Party Conference 2025
Creative PEC Policy Adviser Emily Hopkins attended the Labour Party Conference in September 2025.
Association of South-East Asian Nations’ long-term view of the creative economy
John Newbigin examines the ASEAN approach to sustainability and the creative economy.
Culture, community resilience and climate change: becoming custodians of our planet
Reflecting on the relationship between climate change, cultural expressions and island states.
Cultural Industries at the Crossroads of Tourism and Development in the Maldives
Eduardo Saravia explores the significant opportunities – and risks – of relying on tourism.
When Data Hurts: What the Arts Can Learn from the BLS Firing
Douglas Noonan and Joanna Woronkowicz discuss the dangers of dismissing or discarding data that does…
Rewriting the Logic: Designing Responsible AI for the Creative Sector
As AI reshapes how culture is made and shared, Ve Dewey asks: Who gets to create? Whose voices are e…

